Muscle Loss in Perimenopause: What the Scale Won't Tell You
Written and edited by Sarah Bonza, MD, MPH, FAAFP, MSCP, DipABLM, NBC-HWC
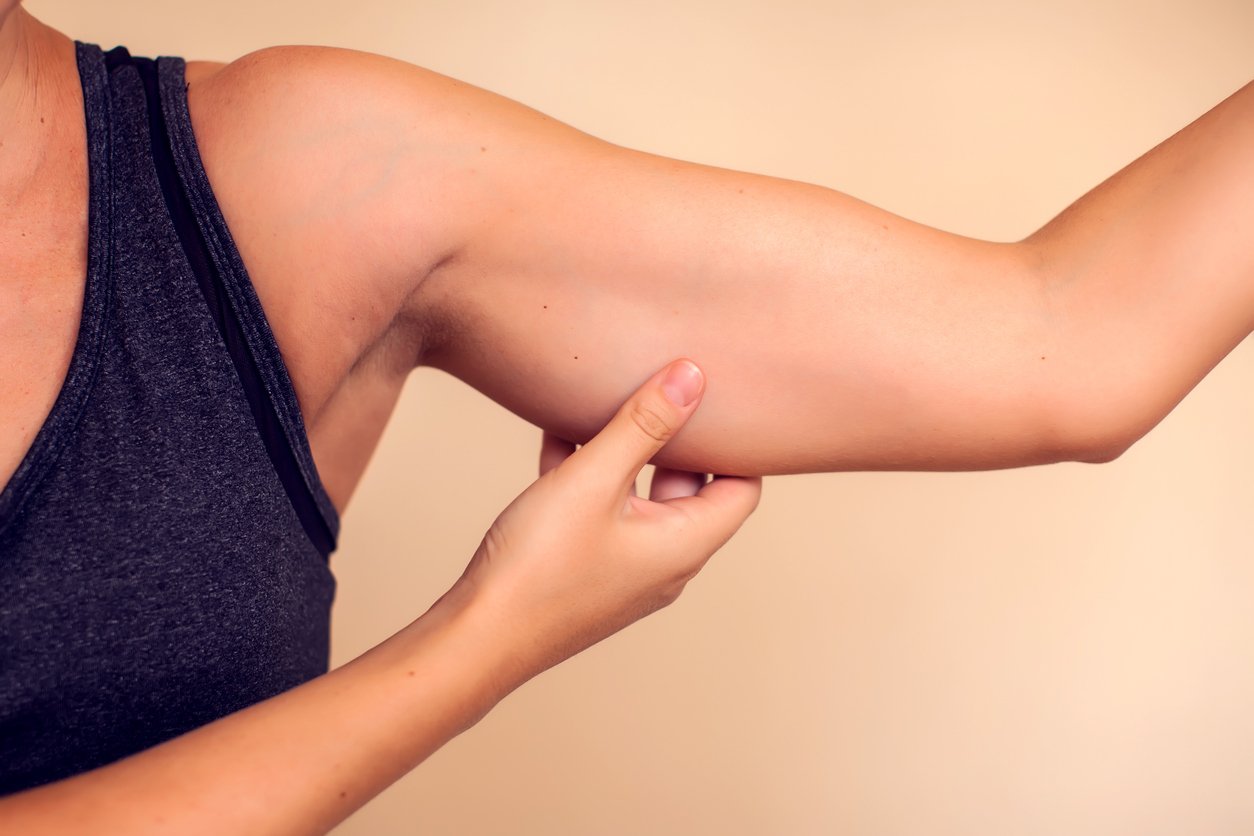
Muscle is the organ of longevity.
Two years ago, I picked up a barbell for the first time with the self-consciousness of someone who had spent two decades telling other people to exercise.
I knew the physiology. I could recite the guidelines. What I did not know — what no textbook taught me, and what no lecture ever conveyed — is what it feels like to watch your own body reorganize itself from the inside out while the number on the scale barely moves.
That gap between what I knew and what I learned is what this article is about.
Because here is the thing about the sentence we've all repeated: you can't out-exercise a bad diet. It's true. It's also only half of a sentence, and the missing half has cost midlife women more than almost any other piece of health advice I can think of.
You also cannot diet your way to a strong midlife body. You can shrink. You can absolutely get smaller. But smaller is not the same as stronger, and after 40, the difference between those two outcomes is the difference between the next forty years being expansive or being careful.
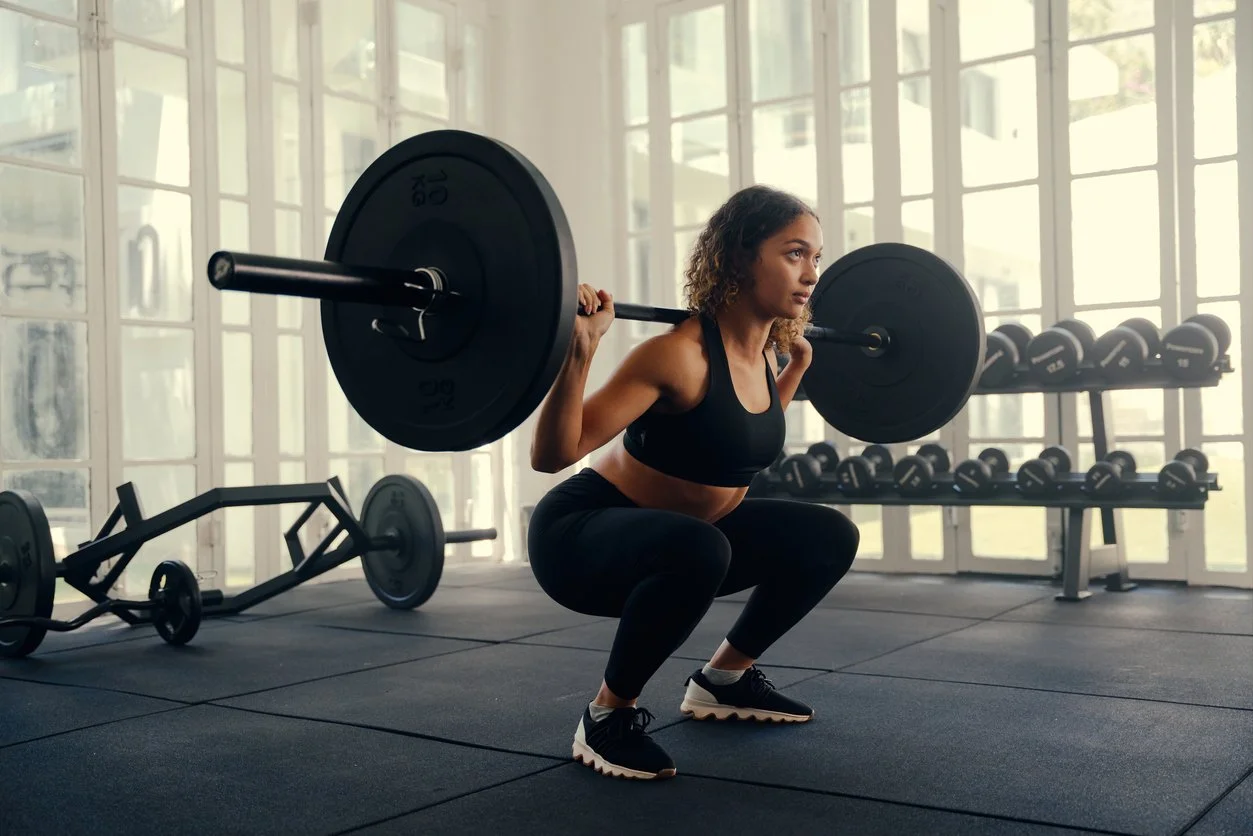
If your scoreboard is weight, you can lose that entire transition without ever seeing it. Muscle is the asset. Fat loss, when it happens, is a side effect.
The scale is the wrong scoreboard
Two years in, my weight has moved very little. My body has changed enormously.
That is not a paradox. It's physiology — and it's the single most important thing I want you to take from this piece. Body weight is a sum. It tells you nothing about what the sum is made of. Two women can stand on the same scale at the same number and have entirely different metabolic futures depending on how much of that number is muscle.
The clinical literature makes this uncomfortably clear. When researchers followed women through the menopause transition in the Study of Women's Health Across the Nation (SWAN), they found something that reframes how we should read a bathroom scale entirely. Beginning roughly two years before the final menstrual period, the rate of fat gain doubled and lean mass began to fall — and the two changes largely offset each other, so total body weight didn't accelerate in a way anyone would notice [1]. Women were becoming metabolically different while the scale stayed quiet.
If your scoreboard is weight, you can lose that entire transition without ever seeing it. Muscle is the asset. Fat loss, when it happens, is a side effect.
Why this gets harder after 40 — and why that is not a character flaw
I want to say this plainly, because I hear the opposite in my exam room every week: the fact that what worked at 32 stops working at 47 is not evidence of failing willpower.
It's also, notably, not evidence of a "broken metabolism" in the way that phrase is usually meant. When investigators pooled doubly-labeled-water measurements across more than 6,400 people from 29 countries — the gold standard for measuring real-world energy expenditure — they found that fat-free-mass-adjusted daily energy expenditure holds remarkably steady from age 20 through age 60, then declines afterward [2]. Metabolism does not fall off a cliff at 40.
What changes is the tissue. Adjusted for lean mass, the engine is fine. The engine is simply getting smaller.
Age-related loss of muscle mass in women runs at roughly 0.4% per year across the studies that have measured it directly — and here is the part that matters clinically: strength is lost two to five times faster than mass, and loss of strength is a more consistent predictor of disability and death than loss of muscle bulk [3]. We have spent years measuring the wrong thing. Size is not the outcome. Force production is.
So the honest version of the story is this: your metabolism didn't betray you. Your body composition drifted, quietly, for a decade, while nobody handed you a plan to defend it. Dieting alone accelerates that drift, because weight lost without a resistance stimulus comes off as both fat and lean tissue.

Body weight is a sum. It tells you nothing about what the sum is made of.
The metabolic case: muscle is your largest glucose sink
If I could put one physiological fact on a billboard outside every primary care clinic in America, it would be this one.
Skeletal muscle is the predominant site of insulin-mediated glucose uptake after a meal. It is where the sugar goes. And impaired glucose uptake in muscle is not a late complication of type 2 diabetes — it is the initiating defect, detectable decades before beta-cell failure and before a single abnormal fasting glucose shows up on a panel [4].
Read that again, because it reorganizes the whole prevention conversation. The tissue that fails first in type 2 diabetes is the tissue you can voluntarily rebuild.
The population data track with the mechanism. In an analysis of more than 13,000 adults in NHANES III, higher muscle mass relative to body size was associated with better insulin sensitivity and lower risk of prediabetes — and the relationship held across the full range, not just at the frail low end [5]. More muscle meant a bigger sink for glucose to go into. Less muscle meant a smaller one.
That's the chain. Muscle → better insulin sensitivity → less time spent with elevated glucose and insulin → less of the chronic low-grade inflammatory signaling that drives so much of what we treat downstream.
And muscle isn't a passive storage tank. It is an endocrine organ in its own right. Contracting skeletal muscle produces and secretes hundreds of signaling peptides — myokines — that communicate with adipose tissue, liver, pancreas, bone, and brain [6]. When you train, you are not just building a stronger leg. You are running a systemic signaling program that a caloric deficit alone cannot switch on.
This is the precise reason "eat less" and "eat less plus lift" are not variations on the same intervention. They are different drugs.
This is the precise reason "eat less" and "eat less plus lift" are not variations on the same intervention. They are different drugs.
Muscle as insurance: the outcomes that actually matter
Everything above is mechanism. Here is what it buys you.
Mortality. A meta-analysis of 16 prospective cohorts found muscle-strengthening activity associated with a 10–17% lower risk of all-cause mortality, cardiovascular disease, total cancer, and diabetes — independent of aerobic activity. Most of the benefit arrived at roughly 30–60 minutes per week, with the largest effects when strength work was combined with aerobic activity [7]. Thirty to sixty minutes. Per week. That is a dose almost anyone can find.
Strength as a vital sign. In the PURE study — nearly 140,000 adults across 17 countries — every 5 kg reduction in grip strength was associated with a 16% higher risk of death from any cause, and grip strength outperformed systolic blood pressure as a predictor of all-cause mortality [8]. We measure blood pressure at every visit. We almost never measure strength.
Protecting the body you already have while you lose weight. In a randomized trial of 160 older adults with obesity, weight loss combined with resistance training — or with resistance plus aerobic training — attenuated the loss of lean mass seen with weight loss plus aerobic training alone. Resistance training was also the only intervention that prevented the weight-loss-induced drop in bone mineral density at the total hip [9]. Weight loss without resistance training costs you muscle and bone. This is the trial to hand to anyone who says they'll "lift later, after the weight comes off."
Bone. In the LIFTMOR randomized controlled trial, postmenopausal women with osteopenia or osteoporosis performed twice-weekly, 30-minute supervised high-intensity resistance and impact training. Over eight months, lumbar spine bone density rose 2.9% in the training group while falling 1.2% in the low-intensity control group; femoral neck density and height followed the same pattern (Figure 1). Compliance was 92%, and there was a single adverse event — a minor back spasm [10]. Heavy, supervised, technique-first lifting was not the danger we long assumed it was for women with low bone mass. It was the treatment.
Look closely at what Figure 1 is showing, because it is easy to miss. Both groups were postmenopausal women with low bone mass. Both groups exercised. The bars go in opposite directions. The control group did not merely gain less bone — they lost bone, on schedule, while doing gentle exercise. Intensity was the variable.

Figure 1. Change in bone mineral density over 8 months of twice-weekly, 30-minute supervised sessions in postmenopausal women with low bone mass. Data from Watson et al. [10].
Falls. Exercise programs built around balance and functional training reduce the rate of falls by about 24%, and programs that add resistance training to balance work reduce it by roughly 34% [11].
And what a fall can cost. In a population-based cohort, one year after hip fracture, 20% of patients had died compared with 11% of matched controls, 51% had meaningfully worse disability compared with 16% of controls, and the cumulative incidence of first nursing home admission was 64% versus 7% (Figure 2) [12].
Sixty-four percent versus seven percent. That is not a statistic about bones. That is a statistic about whether you stay in your own home.

Figure 2. Outcomes at one year following hip fracture compared with age- and sex-matched community controls. Data from Leibson et al. [12].
Figure 2 is the reason I stopped thinking about strength training as a wellness activity. Every bar on the left side of that chart is a downstream consequence of a body that could not absorb a single bad moment. The training in Figure 1 and the outcomes in Figure 2 are the same conversation, separated by about twenty years.
This is what I mean when I say muscle is insurance. Not vanity, not aesthetics — insurance against the specific, foreseeable events that end independence.
What this actually looks like
Two to three sessions a week. Thirty to sixty minutes total. Compound movements loaded heavily enough that the last two repetitions are genuinely difficult, with technique coached first and load added gradually. Progressive overload — the weight has to go up over months, or the stimulus stops being a stimulus.
Protein matters more than most midlife women are eating. The PROT-AGE consensus recommends 1.0–1.2 g/kg/day for healthy older adults, with 1.2–1.5 g/kg/day in the setting of acute or chronic illness, alongside resistance exercise. Notably, they specifically flag that people with severe kidney disease not on dialysis are the exception and may need protein restriction [13]. If you have kidney disease, this is a conversation with your physician, not a blog.
And track something other than weight. Track the load on the bar. Track how many push-ups. Track whether you can carry the groceries in one trip.

Instead of tracking your weight, start tracking the load on the bar or how many push-ups you can do.
What I'd tell my 35-year-old self
I'd tell her that the decade she is about to spend trying to take up less space is a decade she could spend becoming harder to break.
I'd tell her that the discipline she is pouring into restriction would compound differently if she poured it into loading her skeleton instead — that at 35 she is building the reserve she will spend at 75, and that nobody is going to warn her when the withdrawals begin.
I'd tell her the scale will lie to her by omission for years.
And I'd tell her the thing I couldn't have believed at the time: that she'd stop chasing a smaller body, start building a stronger one, and find that everything else she'd been chasing followed along behind.
This article is for educational purposes and is not a substitute for individualized medical advice. Before beginning a resistance training program — particularly if you have known osteoporosis, cardiovascular disease, or kidney disease — talk with your physician about what is appropriate for you.

Ready to build your plan? At Bonza Health, we approach midlife metabolic health, bone density, and hormonal transitions as one connected system — because your body treats them that way. Schedule a consultation.
References
[1] G. A. Greendale, B. Sternfeld, M. Huang, W. Han, C. Karvonen-Gutierrez, K. Ruppert, J. A. Cauley, J. S. Finkelstein, S.-F. Jiang, and A. S. Karlamangla, "Changes in body composition and weight during the menopause transition," JCI Insight, vol. 4, no. 5, art. e124865, Mar. 2019, https://doi.org/10.1172/jci.insight.124865. PMID: 30843880.
[2] H. Pontzer, Y. Yamada, H. Sagayama, et al., "Daily energy expenditure through the human life course," Science, vol. 373, no. 6556, pp. 808–812, Aug. 2021, https://doi.org/10.1126/science.abe5017. PMID: 34385400.
[3] W. K. Mitchell, J. Williams, P. Atherton, M. Larvin, J. Lund, and M. Narici, "Sarcopenia, dynapenia, and the impact of advancing age on human skeletal muscle size and strength; a quantitative review," Frontiers in Physiology, vol. 3, art. 260, Jul. 2012, https://doi.org/10.3389/fphys.2012.00260. PMID: 22934016.
[4] R. A. DeFronzo and D. Tripathy, "Skeletal muscle insulin resistance is the primary defect in type 2 diabetes," Diabetes Care, vol. 32, suppl. 2, pp. S157–S163, Nov. 2009, https://doi.org/10.2337/dc09-s302. PMID: 19875544.
[5] P. Srikanthan and A. S. Karlamangla, "Relative muscle mass is inversely associated with insulin resistance and prediabetes. Findings from the Third National Health and Nutrition Examination Survey," Journal of Clinical Endocrinology & Metabolism, vol. 96, no. 9, pp. 2898–2903, Sep. 2011, https://doi.org/10.1210/jc.2011-0435. PMID: 21778224.
[6] B. K. Pedersen and M. A. Febbraio, "Muscles, exercise and obesity: skeletal muscle as a secretory organ," Nature Reviews Endocrinology, vol. 8, no. 8, pp. 457–465, Aug. 2012, https://doi.org/10.1038/nrendo.2012.49. PMID: 22473333.
[7] H. Momma, R. Kawakami, T. Honda, and S. S. Sawada, "Muscle-strengthening activities are associated with lower risk and mortality in major non-communicable diseases: a systematic review and meta-analysis of cohort studies," British Journal of Sports Medicine, vol. 56, no. 13, pp. 755–763, Jul. 2022, https://doi.org/10.1136/bjsports-2021-105061. PMID: 35228201.
[8] D. P. Leong, K. K. Teo, S. Rangarajan, et al., "Prognostic value of grip strength: findings from the Prospective Urban Rural Epidemiology (PURE) study," The Lancet, vol. 386, no. 9990, pp. 266–273, Jul. 2015, https://doi.org/10.1016/s0140-6736(14)62000-6. PMID: 25982160.
[9] D. T. Villareal, L. Aguirre, A. B. Gurney, D. L. Waters, D. R. Sinacore, E. Colombo, R. Armamento-Villareal, and C. Qualls, "Aerobic or resistance exercise, or both, in dieting obese older adults," New England Journal of Medicine, vol. 376, no. 20, pp. 1943–1955, May 2017, https://doi.org/10.1056/nejmoa1616338. PMID: 28514618.
[10] S. L. Watson, B. K. Weeks, L. J. Weis, A. T. Harding, S. A. Horan, and B. R. Beck, "High-intensity resistance and impact training improves bone mineral density and physical function in postmenopausal women with osteopenia and osteoporosis: the LIFTMOR randomized controlled trial," Journal of Bone and Mineral Research, vol. 33, no. 2, pp. 211–220, Feb. 2018, https://doi.org/10.1002/jbmr.3284. PMID: 28975661.
[11] C. Sherrington, N. J. Fairhall, G. K. Wallbank, A. Tiedemann, Z. A. Michaleff, K. Howard, L. Clemson, S. Hopewell, and S. E. Lamb, "Exercise for preventing falls in older people living in the community," Cochrane Database of Systematic Reviews, vol. 1, no. 1, art. CD012424, Jan. 2019, https://doi.org/10.1002/14651858.cd012424.pub2. PMID: 30703272.
[12] C. L. Leibson, A. N. A. Tosteson, S. E. Gabriel, J. E. Ransom, and L. J. Melton, "Mortality, disability, and nursing home use for persons with and without hip fracture: a population-based study," Journal of the American Geriatrics Society, vol. 50, no. 10, pp. 1644–1650, Oct. 2002, https://doi.org/10.1046/j.1532-5415.2002.50455.x. PMID: 12366617.
[13] J. Bauer, G. Biolo, T. Cederholm, M. Cesari, A. J. Cruz-Jentoft, J. E. Morley, S. Phillips, C. Sieber, P. Stehle, D. Teta, R. Visvanathan, E. Volpi, and Y. Boirie, "Evidence-based recommendations for optimal dietary protein intake in older people: a position paper from the PROT-AGE Study Group," Journal of the American Medical Directors Association, vol. 14, no. 8, pp. 542–559, Aug. 2013, https://doi.org/10.1016/j.jamda.2013.05.021. PMID: 23867520.